Added a dashboard with personal & store metrics which increased the engagement associates have with their work performance.
Created a dashboard to show cashier performance metrics.
Impact:
Established baseline understanding of mobile app and desktop app users (store associates)
Validated hypothesis by decreasing in store shrink by 31%
Validated hypotheses about associate communication methods in regards to our product’s future
Timeline: 2 months
Team: 1 UX designer, 1 Staff UX designer, 1 Product Manager and 2 developers
Platform/Device: Desktop app only
Business intent of this page: Reduce Store Shrink. Store shrink is when merchandise leaves the store without being paid for, both intentionally or not.
By getting associates to perform their work more consistently, it was hypothesized that store shrinkage would decrease.
Research
Prior to creating this dashboard, I dedicated my efforts to comprehending the individuals who would find value in the digital presentation of data and getting acquainted with their existing work and communication methods.
It was important for me to understand how this information was already being tracked and how it was being presented to cashiers to see if specific metrics were more culturally helpful vs. business helpful.
Research Methods:
- In-Store Associate Interviews
- Associate Surveys about their experience, feedback timeframes, goals
- Business Partner & Subject Matter Expert Interviews
Design
During the process of brainstorming designs, it was crucial to keep exploring the existing design system and dashboards used by the company. I wasn’t only creating this dashboard for my product, but also ensuring its seamless integration with other company applications for smooth transitions.
Collaborating with developers played a vital role in guaranteeing the smooth functioning of the dashboard and backend data retrieval. Design modifications across different product pages were vital for the dashboard and the overall product to operate smoothly.
Main parts I thought about when designing:
- Company Dashboard Comparison (Other product’s dashboard layouts and content)
- Other Dashboard Page Type Layouts & Components
- General Information Architecture of Data Visuals
- Data retrieval, functionality of having certain metrics show on the page
Team Reasoning
Stakeholder Goal: Get more associate engagement on the job and within the app to increase productivity and thus reduce store shrink.
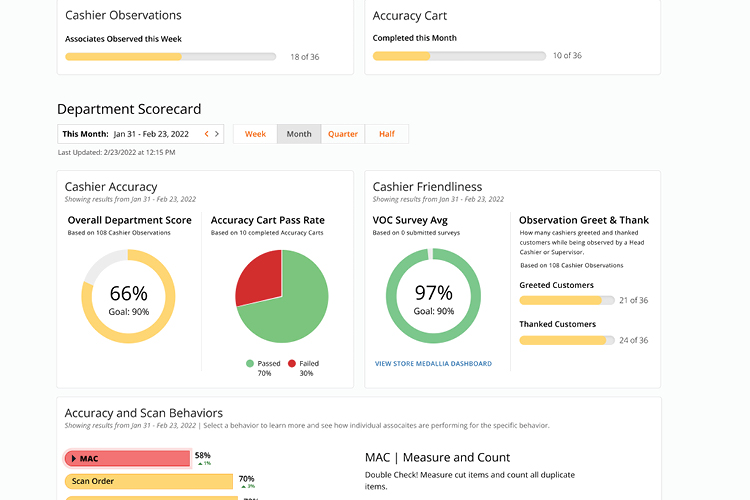
Create a page in this app so associates don’t need to rely on their supervisors to get performance feedback. This page will motivate associates regarding their personal performance and increase their efficiency of doing their jobs.
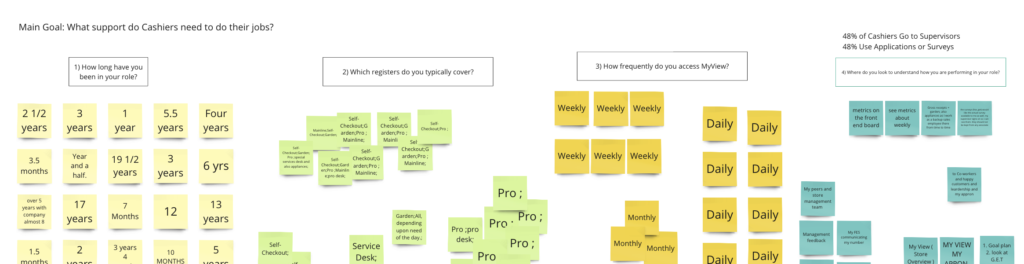
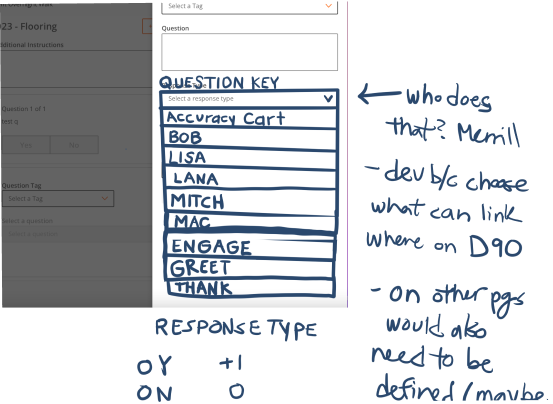
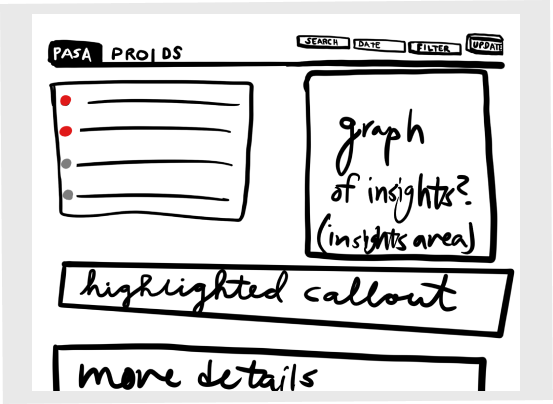
Product Team Goal: Learn how to gather that performance data to use in our app. With that data, connect the various performance metrics stored in the servers and show them in a visual format, a dashboard in our product.
My Reasoning
Research: I was interested in if, why and how other products had dashboards because this dashboard page could use those elements and a standard dashboard layout in the company’s products would make it simpler to navigate.
I spoke with associates and stakeholders to make sure the dashboard would be used, understood, and seen as valuable by associates. Both sides needed to understand and value the information for the project to be successful. This research also helped me understand the value associates vs. stakeholders see in the app.
Design/UI: By looking into other product dashboards, I understood there was no set design standard, so with designing I had free rein.
Final Dashboard Page Design